Environmental Considerations
Environmental Considerations
Environmentally Conscious Asset Management
Through the renewal of facilities in investment properties and collaboration with business companies that have business relationships with ADR, we are progressively implementing energy-saving, water-saving, and other environmentally friendly initiatives in all properties we own.
As of January 2025, LED lighting is installed in 161 properties (55.7 % of portfolio).
c. Installing heat shielding paint roofing
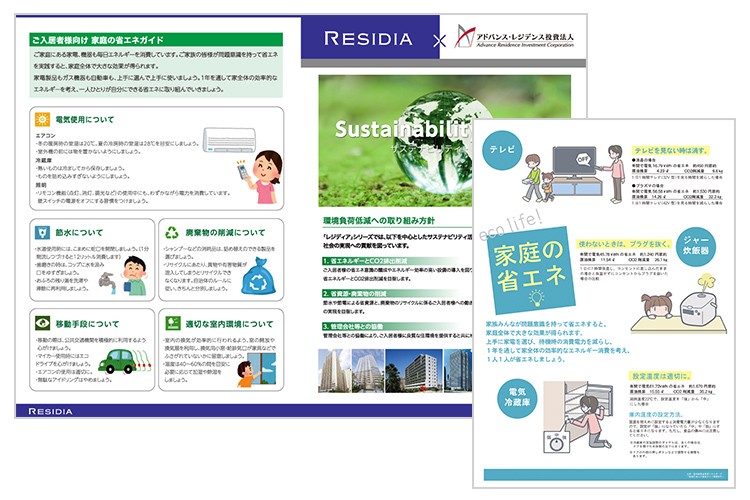
d. Encouraging tenants to conserve energy usage through posters on common area billboards and periodical “RESIDIA News” and sending of sustainability guides
e. Installation of water-saving equipment
ADR is working to reduce water consumption by installing water-saving sanitary fixtures (toilet, washbasin faucets, etc.) during renovation work in private areas.
f.Waste Reduction Initiatives
ADR strives to improve the recycling rate by implementing appropriate segregation and management of waste generated from restoration work. And also, ADR strives to reduce the amount of waste by carefully selecting the scope of work during restoration work and repairing rather than easily replacing items.
g.Environmental risk assessment at acquisition
When acquiring properties, ADR obtains real estate appraisal reports, engineering reports,etc., in addition to on-site inspections and disclosed materials from the seller, and conducts surveys related to soil contamination and hazardous substances such as asbestos and PCBs.
h.Brownfield redevelopment
When soil contamination is confirmed, ADR maintains proper treatment and procedures in accordance with laws and regulations. ADR takes measures to prevent the spread of soil contamination and performs countermeasure construction (mining and removal of contaminated soil) as necessary.
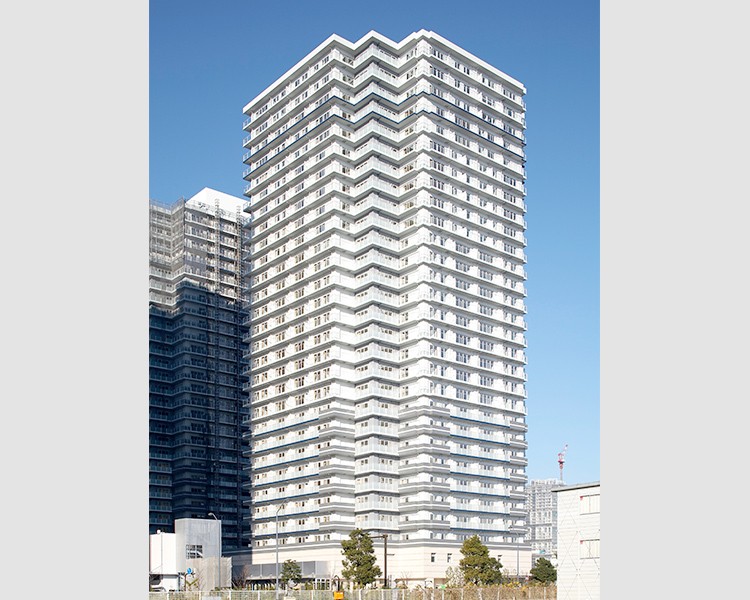
i.Consideration for Biodiversity
ADR recognizes the importance of the various benefits provided by ecosystems, and is committed to taking biodiversity into consideration. In the RESIDIA Tower Kamiikebukuro, plants including a variety of native species that add color to the four seasons have been arranged to provide valuable green space for residents and the community, and part of the land is open to the public as public open space. In addition, ADR is promoting rooftop greening at some of the properties.
j. Including a criterion concerning initiatives taken on environment in selecting a property manager.
k.Working together with building managers towards shared goals on environmental concerns.
l.Introducing car sharing in parking lots of properties
As of January 2025, 6 properties (2.1% of portfolio) have parking lots for car sharing.
m.Other Initiatives
ADR takes other environmentally friendly measures such as placing green open spaces on its property sites to alleviate heat island effect, paving the property grounds with interlocking paving blocks to lessen inner-city flooding and land subsidence.
1. Extending the Economic Life of Building Structures through Large-scale Repairs and Value Enhancement Renovations
ADR aims to raise unitholders’ value while contributing to the environment (e.g. reducing life cycle CO2 emissions) by extending the economic life and maintaining the value of building structures through large-scale repairs and value enhancement renovations.
2. Environmental Targets and Results (energy consumption, CO2 emissions, water usage and waste volume)
Establishing Policies
IRM has established policies on “Environmental performance data management standards” to improve energy efficiency of ADR’s properties and making effort to reduce the properties’ energy consumption and greenhouse gas emission.
Environmental Targets
For the entire portfolio, we aim to reduce energy consumption by 20% (intensity) and greenhouse gas emissions by 51% (total amount) for SCOPE 1 and 2 by FY2030, and achieve net zero emissions in FY2050 (compared to FY2018).
In FY2023, ADR achieved the 100-percent sourcing of energy used in the common spaces of its properties from renewable energy sources and a 100-percent offset of Scope 2 GHG emissions through the following initiatives.
●Purchase of non-fossil certificates (for the power used in the common areas of properties)
※Purchased FIT non-fossil certificates with tracking information in the renewable energy value market through a vendor (Whole Energy, Inc.)
●Introduction of green heat certificates (for the heat used in the common areas of Pacific Royal Court Minatomirai Ocean Tower)
※Purchased green heat certificates from an issuer (Japan Natural Energy Company Limited)
≪What is a FIT (non-fossil fuel certificate)?≫
FIT: Feed-in Tariff for renewable energy
Non-fossil Certificate...Certificates are issued for electricity generated from "non-fossil power sources (methods of electricity production)" that do not use fossil fuels such as oil and coal.
GHGScope3 calculations are made to determine CO2 emissions throughout the supply chain and to promote efforts toward net zero emissions. (from FY2022)
And ADR has installed electric energy measurement systems in 271 properties (93.6% of the portfolio by total floor space) as of the end of January 2025, in order to improve the actual coverage rate of electricity consumption in our properties. By installing this system, it will be possible to measure the electricity consumption of the exclusive part. ADR encourages tenants to conserve usage through various enlightenment measures.
For tenants, IRM are implementing various enlightenment measures related to energy conservation.
|
Items |
Targets by FY2030 (vs. FY2018) |
Targets by FY2050 |
|---|---|---|
|
Energy Consumption |
20% reduction (intensity) |
- |
|
GHG Emission (CO2) |
Scope 1 & 2: 51% reduction (total) Scope 3: Identification of corresponding categories and scope determination and calculation |
Net zero |
|
Water Usage |
Do not increase (common areas) |
- |
|
Waste Volume |
Recycling rate 65% (emissions related to construction of exclusive use areas) |
- |
Energy Consumption
| FY2018 | FY2020 | FY2021 | FY2022 | FY2023 |
Targets |
||||
|---|---|---|---|---|---|---|---|---|---|
| Coverage |
% Change |
||||||||
|
Total |
Total Usage |
15,749 |
15,354 |
15,266 |
14,274 |
15,306 |
100.0% |
-6.3% |
-20% |
|
Intensity |
0.086 |
0.083 |
0.082 |
0.077 |
0.081 |
||||
|
Electricity |
Total Usage |
14,273 |
13,860 |
13,705 |
13,009 |
13,980 |
100.0% |
-5.5% |
- |
|
Intensity |
0.078 |
0.075 |
0.074 |
0.070 |
0.074 |
||||
|
Fuel |
Total Usage |
1,248 |
1,263 |
1,313 |
1,091 |
1,075 |
100.0% |
-7.5% |
- |
|
Intensity |
0.060 |
0.042 |
0.061 |
0.052 |
0.055 |
||||
|
Ditrict Heaing |
Total Usage |
229 |
230 |
248 |
174 |
251 |
100.0% |
9.7% |
- |
|
Intensity |
0.016 |
0.016 |
0.017 |
0.012 |
0.017 |
||||
GHG Emission(Scope1,2)
| FY2018 | FY2020 | FY2021 | FY2022 | FY2023 |
Targets |
||||
|---|---|---|---|---|---|---|---|---|---|
| Coverage |
% Change |
||||||||
|
Total |
Total Usage |
7,757 |
7,052 |
253 |
188 |
188 |
100.0% |
-97.7% |
-51% |
|
Intensity |
0.043 |
0.038 |
0.001 |
0.001 |
0.000 |
||||
|
Direct Emission |
Total Usage |
219 |
221 |
230 |
188 |
188 |
100.0% |
-13.8% |
- |
|
Intensity |
0.010 |
0.007 |
0.011 |
0.009 |
0.010 |
||||
|
In-direct Emission |
Total Usage |
7,538 |
6,831 |
23 |
0 |
0 |
100.0% |
-100% |
- |
|
Intensity |
0.041 |
0.037 |
0.000 |
0.000 |
0.000 | ||||
GHG Emissions (Scope 3)
|
Category |
FY2022 |
FY2023 (t-CO₂) |
|---|---|---|
| 1. Purchased goods and services | 5,325 |
5,444 |
| 2. Capital goods |
16,945 |
20,503 |
| 3. Fuel- and energy-related activities (not included in Scope 1 or Scope 2) | 44 |
43 |
| 5. Waste generated in operations |
2 |
2 |
| 13. Downstream leased assets(tenants’ energy use) |
24,992 |
26,116 |
| Total |
47,307 |
52,108 |
*Calculated using the guidelines for the calculation of GHG emissions of an organization throughout the supply chain provided by the Ministry of the Environment of Japan.
*The categories not mentioned above either do not have any emission source or are calculated in Scope 1 or 2.
*The data for FY2022 has been retroactively recalculated in accordance with the revised calculation method.
*In calculating Category 13 “Leased assets (subject: Exclusive use areas of owned properties),” for properties for which actual energy consumption in the exclusive use areas of owned properties cannot be determined, estimates based on estimation methods confirmed by a third-party guarantee organization were used.
Water Usage
| FY2018 | FY2020 | FY2021 | FY2022 | FY2023 | Targets by FY2030 (vs FY2018) |
|||
|---|---|---|---|---|---|---|---|---|
|
Coverage |
% Change (vs FY2018) |
|||||||
|
Total Usage (㎥) |
11,035 | 11,263 | 9,879 | 10,637 | 11,289 | 100.0% |
-10.8% |
Do not increase (common areas) |
|
Intensity (㎥/㎡) |
0.069 | 0.070 | 0.061 | 0.065 |
0.062 |
|||
| FY2018 | FY2020 | FY2021 | FY2022 | FY2023 | ||
|---|---|---|---|---|---|---|
| Water intake |
Total Usage (㎥) |
11,035 | 11,263 | 9,879 | 10,637 | 11,289 |
|
Intensity (㎥/㎡) |
0.069 | 0.070 | 0.061 | 0.065 | 0.062 | |
| FY2018 | FY2020 | FY2021 | FY2022 | FY2023 | ||
|---|---|---|---|---|---|---|
| Displacement |
Total Usage (㎥) |
11,035 | 11,263 | 9,879 | 10,637 | 11,289 |
|
Intensity (㎥/㎡) |
0.069 | 0.070 | 0.061 | 0.065 | 0.062 | |
Waste Volume
| FY2019 | FY2020 | FY2021 | FY2022 | FY2023 | Targets and KPI | |
|---|---|---|---|---|---|---|
| Total Volume(t) | 119 | 181 | 115 | 126 | 132 | Recycling rate 65% (emissions related to construction of exclusive use areas) |
|
Recycling Volume (t) |
102 | 160 | 103 | 111 |
121 |
|
|
Recycling Rate(%) |
85.7% | 88.4% | 89.8% | 88.5% | 91.7% |
Calculation method
- Review period results are updated on an annual basis.
FY2023:From January to December, FY2018~FY2022:From April to March - Scope of Reporting
- Only properties held for the full fiscal year are included in the scope of reporting, excluding properties that were traded during the fiscal year.
- “Intensity” is calculated as follows.
Total Usage or Emission (MWh) ÷ Total floor area of common area (m2) - For unit-owned properties, the ADR's ownership percentage is multiplied by the relevant data.
- The calculation of the waste recycling rate is as follows
Recycling rate (%) = (1) Total amount recycled ÷ (2) Total amount x 100
(1)Total amount of waste recycled The amount of waste recycled out of the total amount of waste generated by the restoration work ordered by ITOCHU Urban Community, a group company of the asset management company (㎥).
(2)Total amount of waste generated from the same work (㎥).
*Past performance data may be revised retroactively in accordance with the revision of calculation methods, etc.
*Figures are rounded to the nearest indicated digit.
3. Independent assurance statement (limited assurance)
Environmental performance data for FY2023, with a few exceptions, has been obtained from Sustainability Accounting Co., Ltd. as Independent assurance statement (limited assurance) in accordance with the International Standard for Assurance Engagements ISAE 3000 and ISAE 3410.
The figures in the assurance report include data on properties acquired and sold during the period, and therefore the figures differ from the above actual values.
4. Introducing Internal Carbon Pricing
ADR estimates the energy savings from environment-related construction (e.g., installation of LEDs) as a result of such construction. These are then converted into t-CO2 and multiplied by the assumed price of a carbon tax to quantitatively determine the cost reduction effect that would be achieved if a carbon tax were to be introduced in the future.
5. Introduction of Renewable Diesel, a Next-Generation Biofuel
ADR introduced Neste's next-generation biofuel “Renewable Diesel (RD)” at its property in November 2024. This RD is procured by ITOCHU Corporation, the sponsor group of ADR, and supplied by ITOCHU ENEX CO., LTD. This introduction is the first in Japan *1 and the first by a J-REIT to be used in emergency generators at condominiums.RD is a biofuel that is attracting attention as an alternative to diesel fuel, and it can reduce GHG emissions by up to approximately 90% (compared to diesel oil; in terms of Japanese law, this is effectively a 100% reduction) based on life cycle assessment*2.
*1 As of November 2024.This is the first time in Japan that ITOCHU ENEX CO., LTD, the only distributor of Neste's RD in Japan, has supplied RD for emergency generators in all condominiums, including those for sale.
*2 Life cycle assessment refers to the environmental impact of the entire supply chain process, from the procurement of raw materials necessary for the product, to manufacturing and use.
*3 Outline of RD
Neste MY Renewable Diesel and Neste's Renewable Diesel are next-generation biofuels produced from renewable raw materials such as waste cooking oil and waste animal fat that do not compete with food production, through a hydrogenation refining process by Neste, a world-leading RD and sustainable aviation fuel (SAF) manufacturer (headquarters: Finland). It is possible to reduce GHG (greenhouse gas) emissions by up to 90% compared to petroleum-derived diesel oil based on life cycle assessment, and because it is not subject to energy consumption calculations under Japan's Act on the Rational Use of Energy and the Act on Promotion of Global Warming Countermeasure, it is possible to achieve a 100% reduction in GHG emissions compared to petroleum-derived diesel oil. It also has excellent storage stability and is suitable for long-term storage and can be used as is in vehicles and heavy machinery that use diesel oil.
For more information, please refer to the following website(Japanese only).
https://service.itcenex.com/lp/renewable_diesel/

Neste's RD

Emergency generator
6. Setting Green-lease Contract Clauses
67.7% of tenants are under leasing contract with clauses concerning energy and water conservation (green-lease contract) as of January 2025.
Also ADR will insert green lease clause in the management consignment contract with property manager at the time of future consignments and contract renewals.
7. Supply Chain Management
IRM has established a Sustainability Procurement Policy to put the sustainability policy’s specific component into practice with the cooperation from its suppliers.
Since FY2016, to strengthen the engagement with suppliers, major suppliers including all property management companies that IRM uses as a vendor have been evaluated by conducting surveys at the start of the contract and annually in accordance to the policy, on how they are addressing sustainability issues.
Since IRM believe it is important to have our major suppliers’ understanding and cooperation, IRM have notified our Sustainability Procurement Guideline to our major venders, property management companies and building management companies.
Urban Area Investments
By investing in various kinds of urban properties, ADR promotes the reduction of environmental burden and contribute to the revitalization of cities and communities.
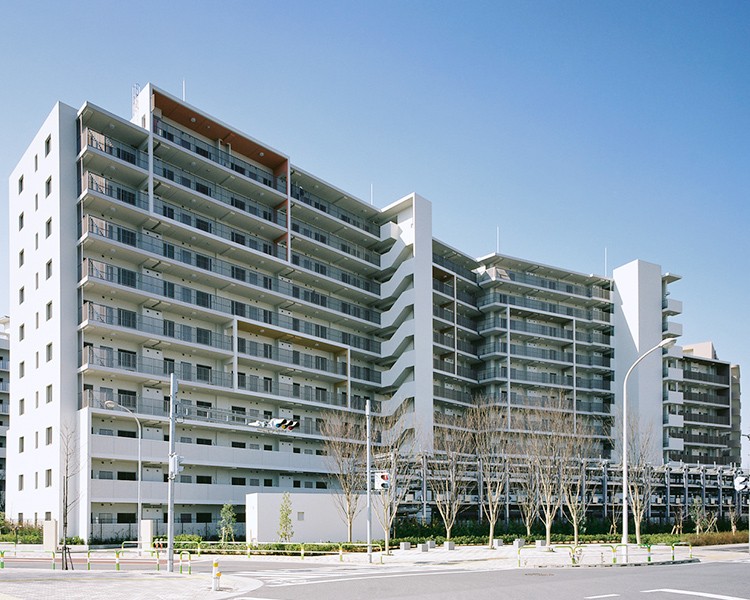
1. Investments in Flexible / Mixed Use Properties
ADR invests in flexible/mixed use properties (as of January 2025, 89 properties, 31% of the portfolio), thereby contributing in reducing environmental impact, revitalizing the area and providing convenient facilities to tenants and local residents. In addition, those flexible /mixed use properties have stores and squares open to public which contributes to the revitalization of the cities and the communities, by providing places for people gather.
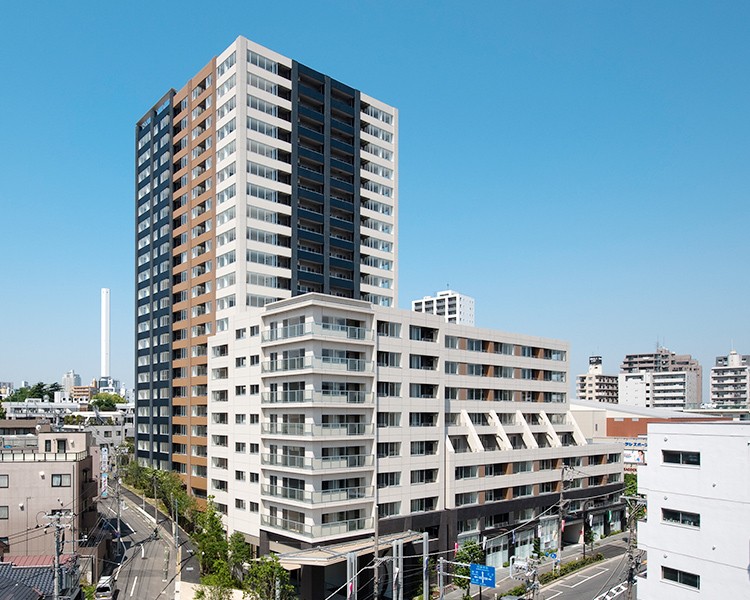
The flexible / mixed use properties that ADR invests in are;
- Properties close to train stations which promote the use of public transportations thereby reducing CO2 emissions 93% (on acquisition price) of properties are located within 10 minute walk from the nearest train station as of January 2025.
In addition, ADR has established criteria (access quality and number of minutes on foot) for the distance from the nearest station regarding property acquisition, within 10 minutes on foot for single and compact types, and within 15 minutes for family and large types. - Properties with convenient facilities such as a supermarkets or convenient stores attached.
- Properties with open space which are publicly accessible. (As of January 2025, 7 properties (2.4% of portfolio))
- Universal design properties that are accessible to senior citizens.
In principle, ADR’s properties have wheelchair-accessible leads (slopes, handrails, private parking lots) installed in the relevant properties based on the Building Standards Act.
In addition, although it is not legally required, a handrail was installed at BRANCHEILE Kohoku 2 based on requests from tenants.
2. Investments Towards Urban Revitalization
By investing in properties developed through urban revitalization project, we contribute to the revitalization of towns and communities and the improvement of convenience for residents in the surrounding areas
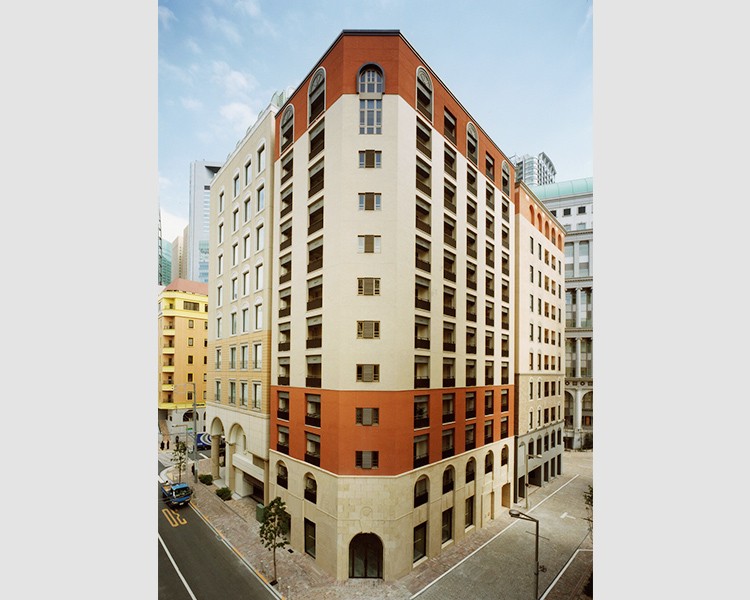
We invest in properties located in the district developed by Urban Revitalization Projects in support of the creation of a community for new production activities and lifestyles based on the initiative of local residents.
The aim of the district is not only creating an attractive landscape while achieving harmony and balance between Italian culture and traditional Japanese culture, but also creating a safe and secure community and enhancing and strengthening partnerships with the government for sustainable regional development. Furthermore, the district is characterized by its adoption of Italian urban revitalization concepts, not only in the superficial adoption of Italian cityscapes, but also in the urban renewal process itself.
3. Investments Towards Existing Urban Brownfield Redevelopment
By investing in existing urban brownfield redevelopment properties ADR contributes in the usage of existing infrastructures such as existing water supply systems, electricity grid, public school facilities. It will also prevent urban sprawl which will save energy involved in commuting and prevent development of green lands.
Cooperation between the Sponsor Group Companies
ADR works together with IRM’s sponsor group companies in various fields to lessen its environmental burden and contribute to local communities.
- Acquisition of sponsor group developed properties
IRM advises on the residential market to help sponsor group companies to succeed in developing flexible / mixed use properties that will satisfy ADR’s acquisition criteria.Acquisition of Green Building Certification. - Property management
The sponsor group property manager who manages the largest share of ADR’s properties cooperates with ADR not only in such measures as promoting energy savings but also in measures such as placing AED equipments in publicly accessible area, whereby contributing to local communities.